
About the Client
MicroTechniX is a company that specializes in the automation of laboratory processes. The company’s team takes care of the entire lab process, from research and development to after-sales, such as maintenance and repairs.
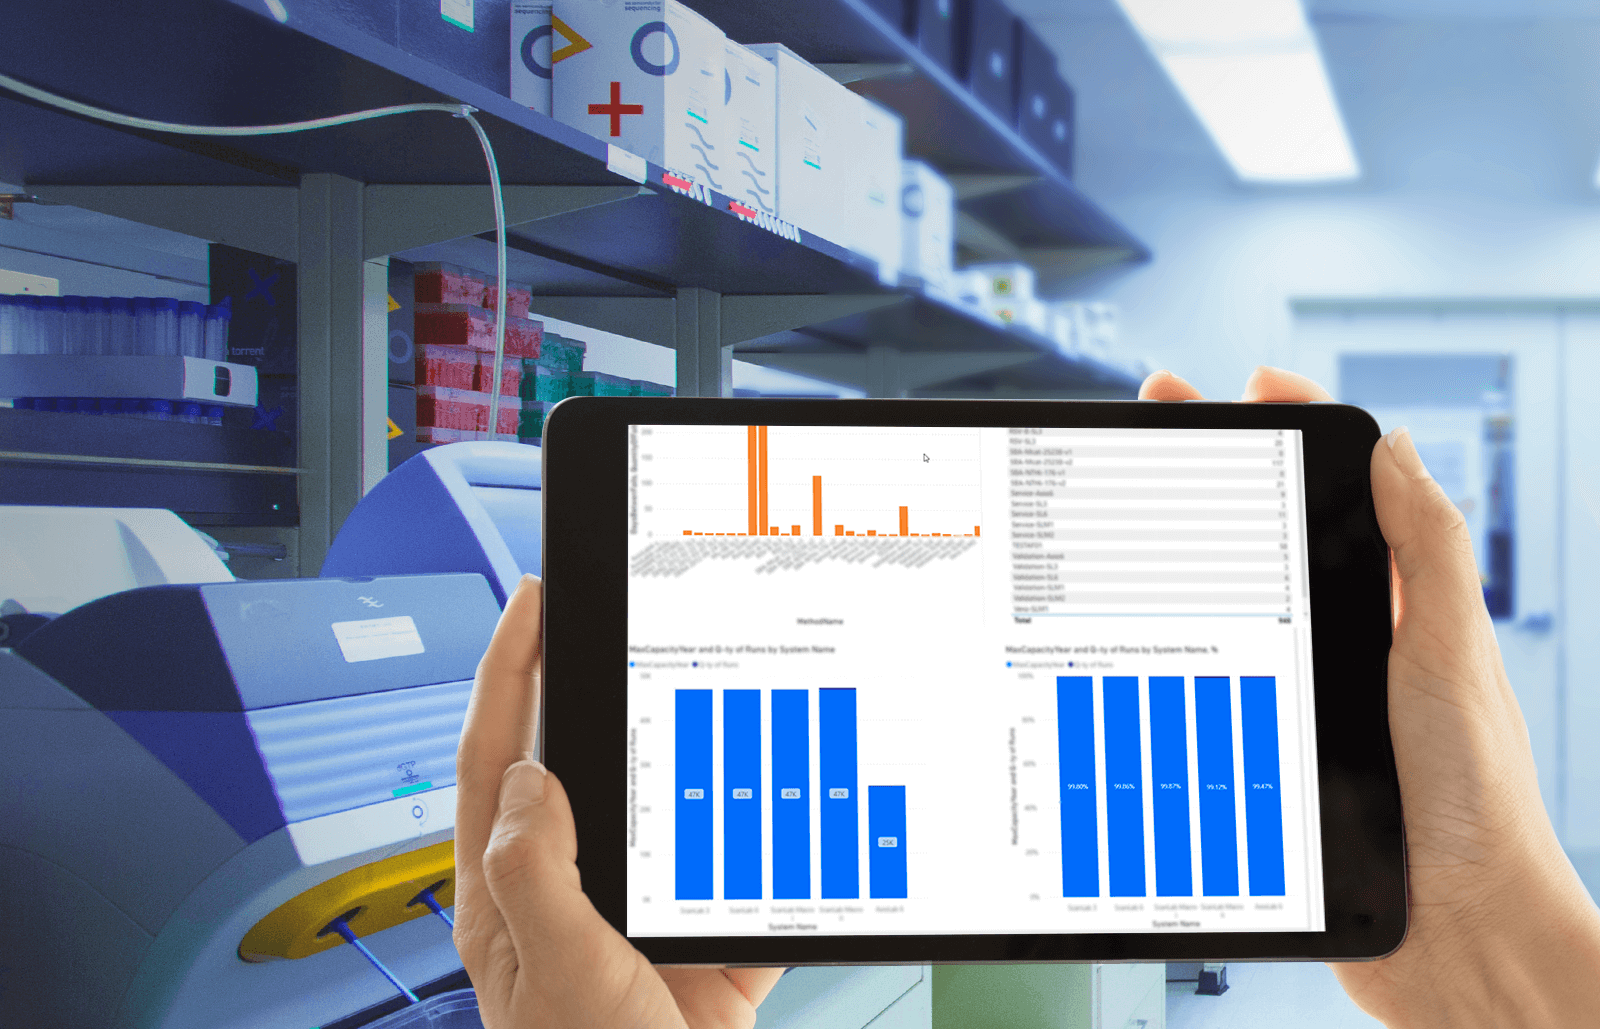
We assisted Microtechnix in building comprehensive visual analytics of one of their core processes: lab equipment utilization. Before diving deeper into our project- BI services for this company, we see it necessary to explain some terms, like “cytomates.” Cytomate is a 100% automated incubator for cell growth with a wide range of temperatures and humidity parameters. We have built an online intelligence visualization of the cytomates usage and capacity for a specific time period. A peculiar feature of this report is that Power BI will update the information in the dashboard automatically once new data is entered into the system. Thus, our client’s team received a comprehensible dashboard with the online visualization of the lab equipment data.
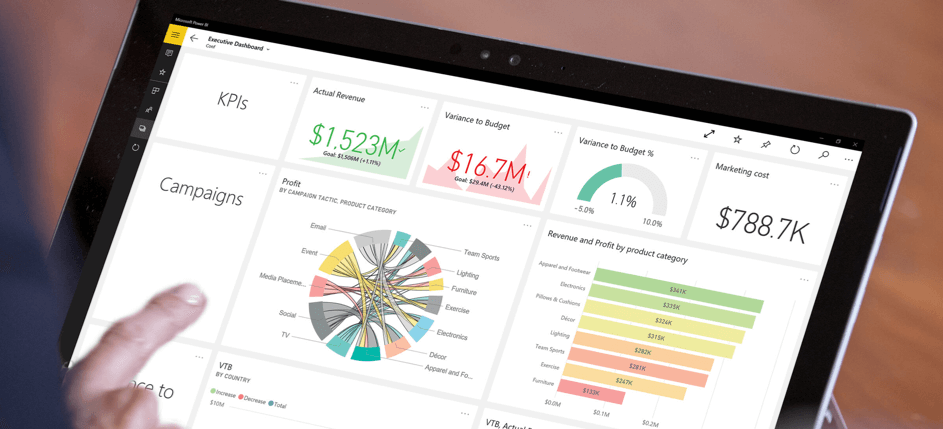
What tools did we choose for providing the most effective Business Intelligence services? Power BI, the solution that was named the leader by Gartner for 12 consecutive years. Power BI helps companies accumulate valuable data of various formats in one place and visualize it so that anyone, even a person unfamiliar with statistics and business analysis, can understand it quickly. More than that, Power BI allows building a report on a special dashboard, connecting this report to the company’s database. Here are Power BI Dashboard Examples we built for our client.
Visualization of the Equipment Utilization/Capacity
Power BI Advantages for Data Visualization
- Visualization of data in comprehensible forms: bars, scatter plots, tables, heatmaps, histograms, etc;
- No specialized technical support is required;
- Creation and adoption of reports for different media ( web, mobile, printed);
- Various data types transformation functions;
- Supporting various data sources ( data upload from Excel, CSV, text files) and the possibility of uniting them;
- Possibility of creation of rich, personalized dashboards;
- Rapid and secure reports extraction;
- No memory of speed obstacles (data retrieval and processing is quick).
Today, most companies choose Tableau or Power BI systems to make data available for even non-technical employees. Data accumulation and visualization with the help of BI systems is the first step to the implementation of transparency principles in the company and to deeper and more data-driven decisions. The next step of the BI system’s natural development is augmented analytics, which you can read in this article.
PEOPLE ALSO READ

AI-Powered Permit Analyzer for Regulatory Compliance
Softengi developed an AI application that streamlines the review of complex permit documents.

Universal Data Lake Publishing Service for Large-Scale Data Publishing
Softengi successfully implemented a data lake publishing solution that addresses EHS vendor's critical data transfer challenges.

Mental Well-Being Clinic for Virryhealth
Softengi developed a virtual clinic with interactive and non-interactive activities where visitors could schedule therapy sessions with medical experts and visit a VR chat in the metaverse to interact with the amazing nature and animals of the African savanna.